


Gold has been one of the best-performing metals of 2020, benefiting from the uncertainty the year has brought. Strong price performance in recent years has also led to a large number of new mines opening. With that in mind, and surrounding concerns of mining’s impact on climate change, S&P Global Market Intelligence (S&P) has published new research on the greenhouse gas (GHG) emissions from gold mines.
To gather insight into GHG emissions in the gold mining industry, S&P reviewed sustainability reports from more than 90 leading gold mines scattered around the globe to compare their carbon dioxide emissions to a variety of production values that they had available. handful of other mines were also included in reporting that was limited to companywide figures.
S&P also reviewed local trends in emissions from gold mines, as mining methods and power sources may vary from region to region. South Africa’s gold mines were excluded from the study as the country is an outlier with anomalously high GHG emissions, due to its coal-heavy power grid, above-average needs for ventilation due to its deepening mines, and falling ore grades.
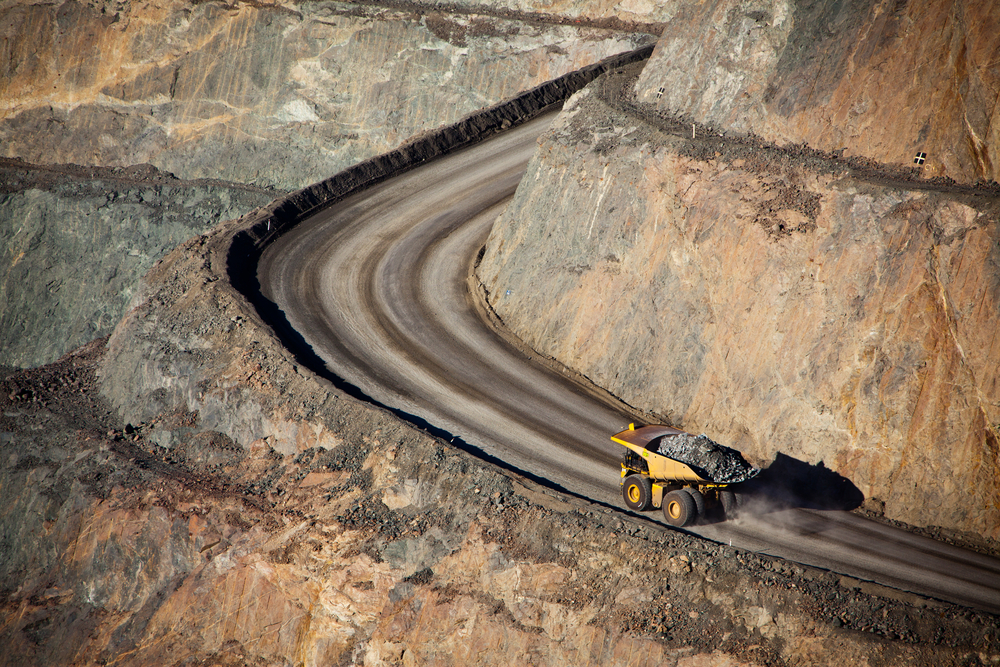
S&P found that underground mines, which operate at higher grades and process less material, generally have lower GHG footprints than their larger open-pit counterparts.
For every ounce of gold produced, underground mines emit less than half the amount of carbon dioxide equivalent, or CO2e, that open-pits do.
Open-pit mines emitted on average more than twice as much CO2e per ounce of gold produced as underground mines, at 0.85 tCO2e/oz and 0.40 tCO2e/oz, respectively.
Open-pit mines also processed roughly five times the amount of ore at an average grade of around 1.05 g/t Au for the population evaluated, versus 3.25 g/t Au for underground mines.
S&P states that figures support the assumption that open-pit mines emit greater amounts of GHG than underground mines at a similar level of production.
While there are more factors in GHG emissions than simply the volume of material moved and processed, S&P notes there is a direct correlation between the two when evaluating emissions as a function of production.
Despite the difference in scale — open-pit mines emit one-third more CO2e and have an average grade one-third lower than underground mines — S&P discovered that both types of mines generate on average similar GHG intensities when looking at CO2e emissions as a function of ore processed.
S&P details that CO2e emissions per kilotonne of ore processed are generally more contained to a similar range for open-pit mines but tend to be much more variable at underground mines.
As a result of that shift in perspective, from a per ounce production to amount of ore processed, underground mines shift to the right, or higher percentiles, of the emissions curve.
Though most mines typically emit less than 70 tCO2e per thousand tonne of ore processed each year, S&P highlights that regional variations do exist.
Based on weighted averages, Australian gold mines have a comparatively high GHG intensity — emitting more GHG per kilotonne of ore processed — only slightly below Russian gold mines.
Canadian mines were found to have among the lowest GHG intensities, in part due to the large proportion of higher-grade underground mines. Another significant factor is the source of power across the country – as much as two-thirds of the country’s electricity is derived from renewable sources and 82 per cent from non-G emitting sources.
By comparison, Australia and Russia continue to derive a large share of their power generation from coal-fired plants.
Across West Africa, much of the power is generated on-site via diesel power; while diesel is also a non-renewable resource, it does not emit as much CO2e as anthracite coal per unit of power generated, a factor in West African mines having a greenhouse gas intensity 13 per cent lower than Australian counterparts.
While this analysis only includes two-thirds of Australia’s gold production, S&P notes that the country sees emissions at the high end of the spectrum, at nearly 33 tCO2e per thousand tonne of ore processed.
By comparison, mines in Canada emit just almost 5 tCO2e less per thousand tonne of ore, at just under 28 tCO2e. Australia’s highest emitters factor greatly in that analysis.
According to S&P, on a per ounce of gold produced basis, Latin American gold mines occupy space across the spectrum. On a per tonne of ore processed basis, however, most occupy space in the lower third of the GHG intensity curve.
Like Canada, a significant share of power at Latin American mines is sourced from hydroelectric dams as well as natural gas-fired plants. While still a combustible fossil fuel, natural gas emits as much as 50-60 per cent less CO2 than equivalent-sized coal plants.
The second part of S&P Global Market Intelligence’s two-part study looked at free cash flow from those same 90 gold mines using S&P’s discount cash flow models. This analysis was based on the most recently published set of consensus metals prices. Highlight findings from Part 2 of the research include:
- Mines with a lower greenhouse gas intensity also yield better free cash flow
- Underground gold mines yield more than twice the free cash flow intensity of open-pit gold mines
- Underground gold mines generate on average US$2,112/tCO2e emissions; this compares to an average of US$951/tCO2e emitted from open-pit gold mines
- Regions of lower greenhouse gas intensity – notably Canada, Central/Eastern Africa and West Africa also generate more free cash for every tonne of emissions; greater free cash flow from larger mines often comes with a disproportionately higher degree of emissions